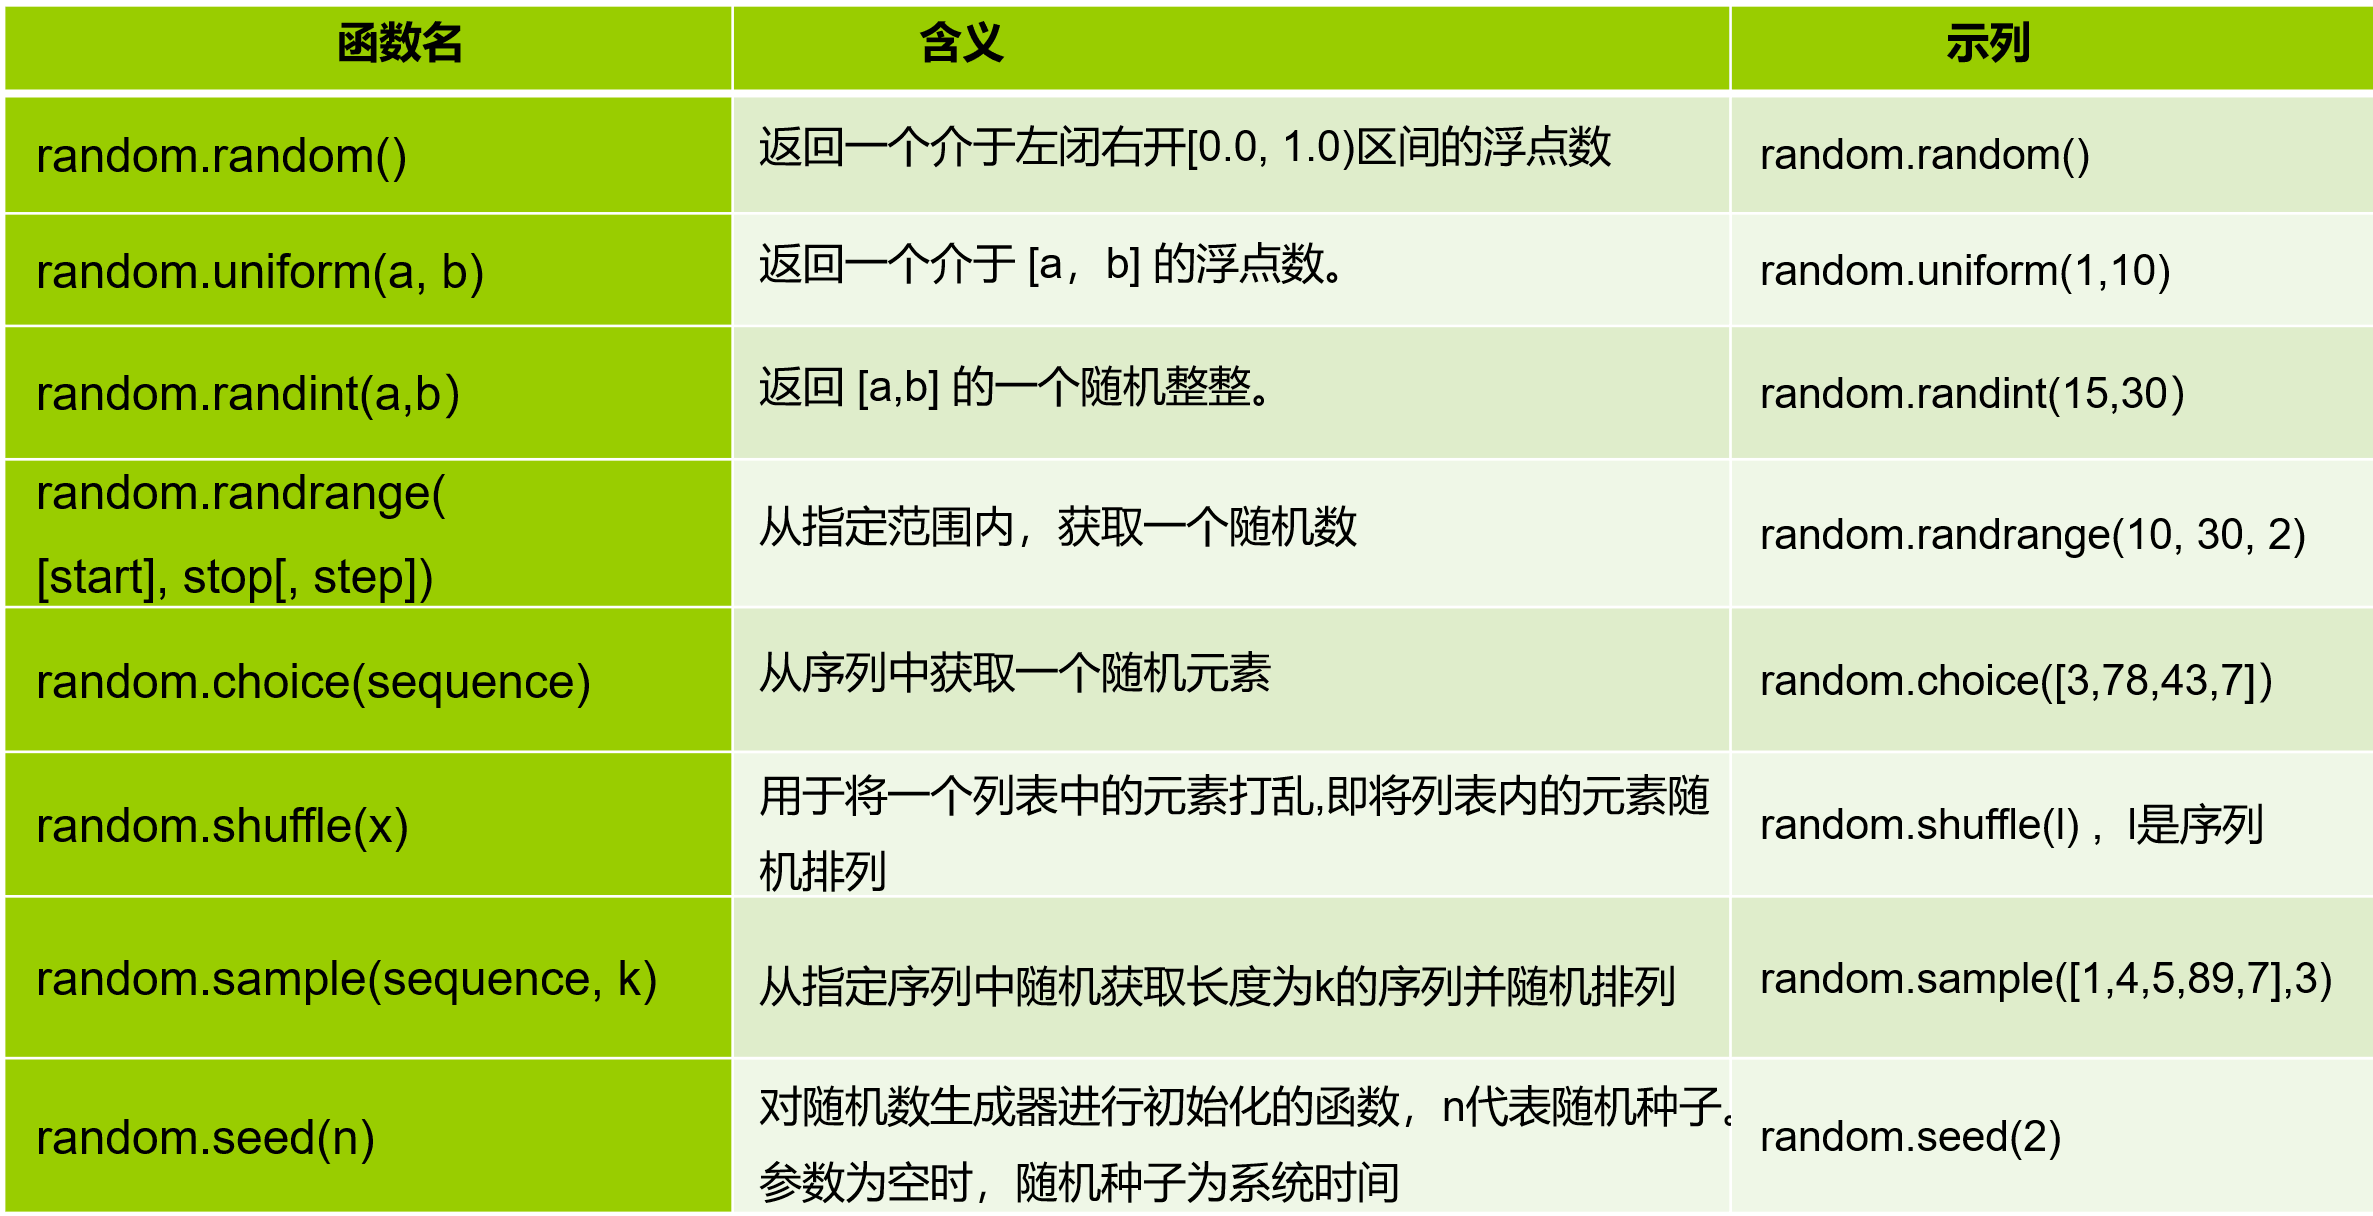
random
random库,用于生成伪随机数
matplotlib
绘图/可视化(仿matlab)
1 | import matplotlib as mpl |
绘制y=x^2和y=x的图形
1 | import matplotlib.pyplot as plt |
1 | sinY = [] |
1 | t = np.arrange(-1, 3, .01) #间隔0.01 |
1 | plt.pause(0.1) # 动态绘制(停顿0.1s) |
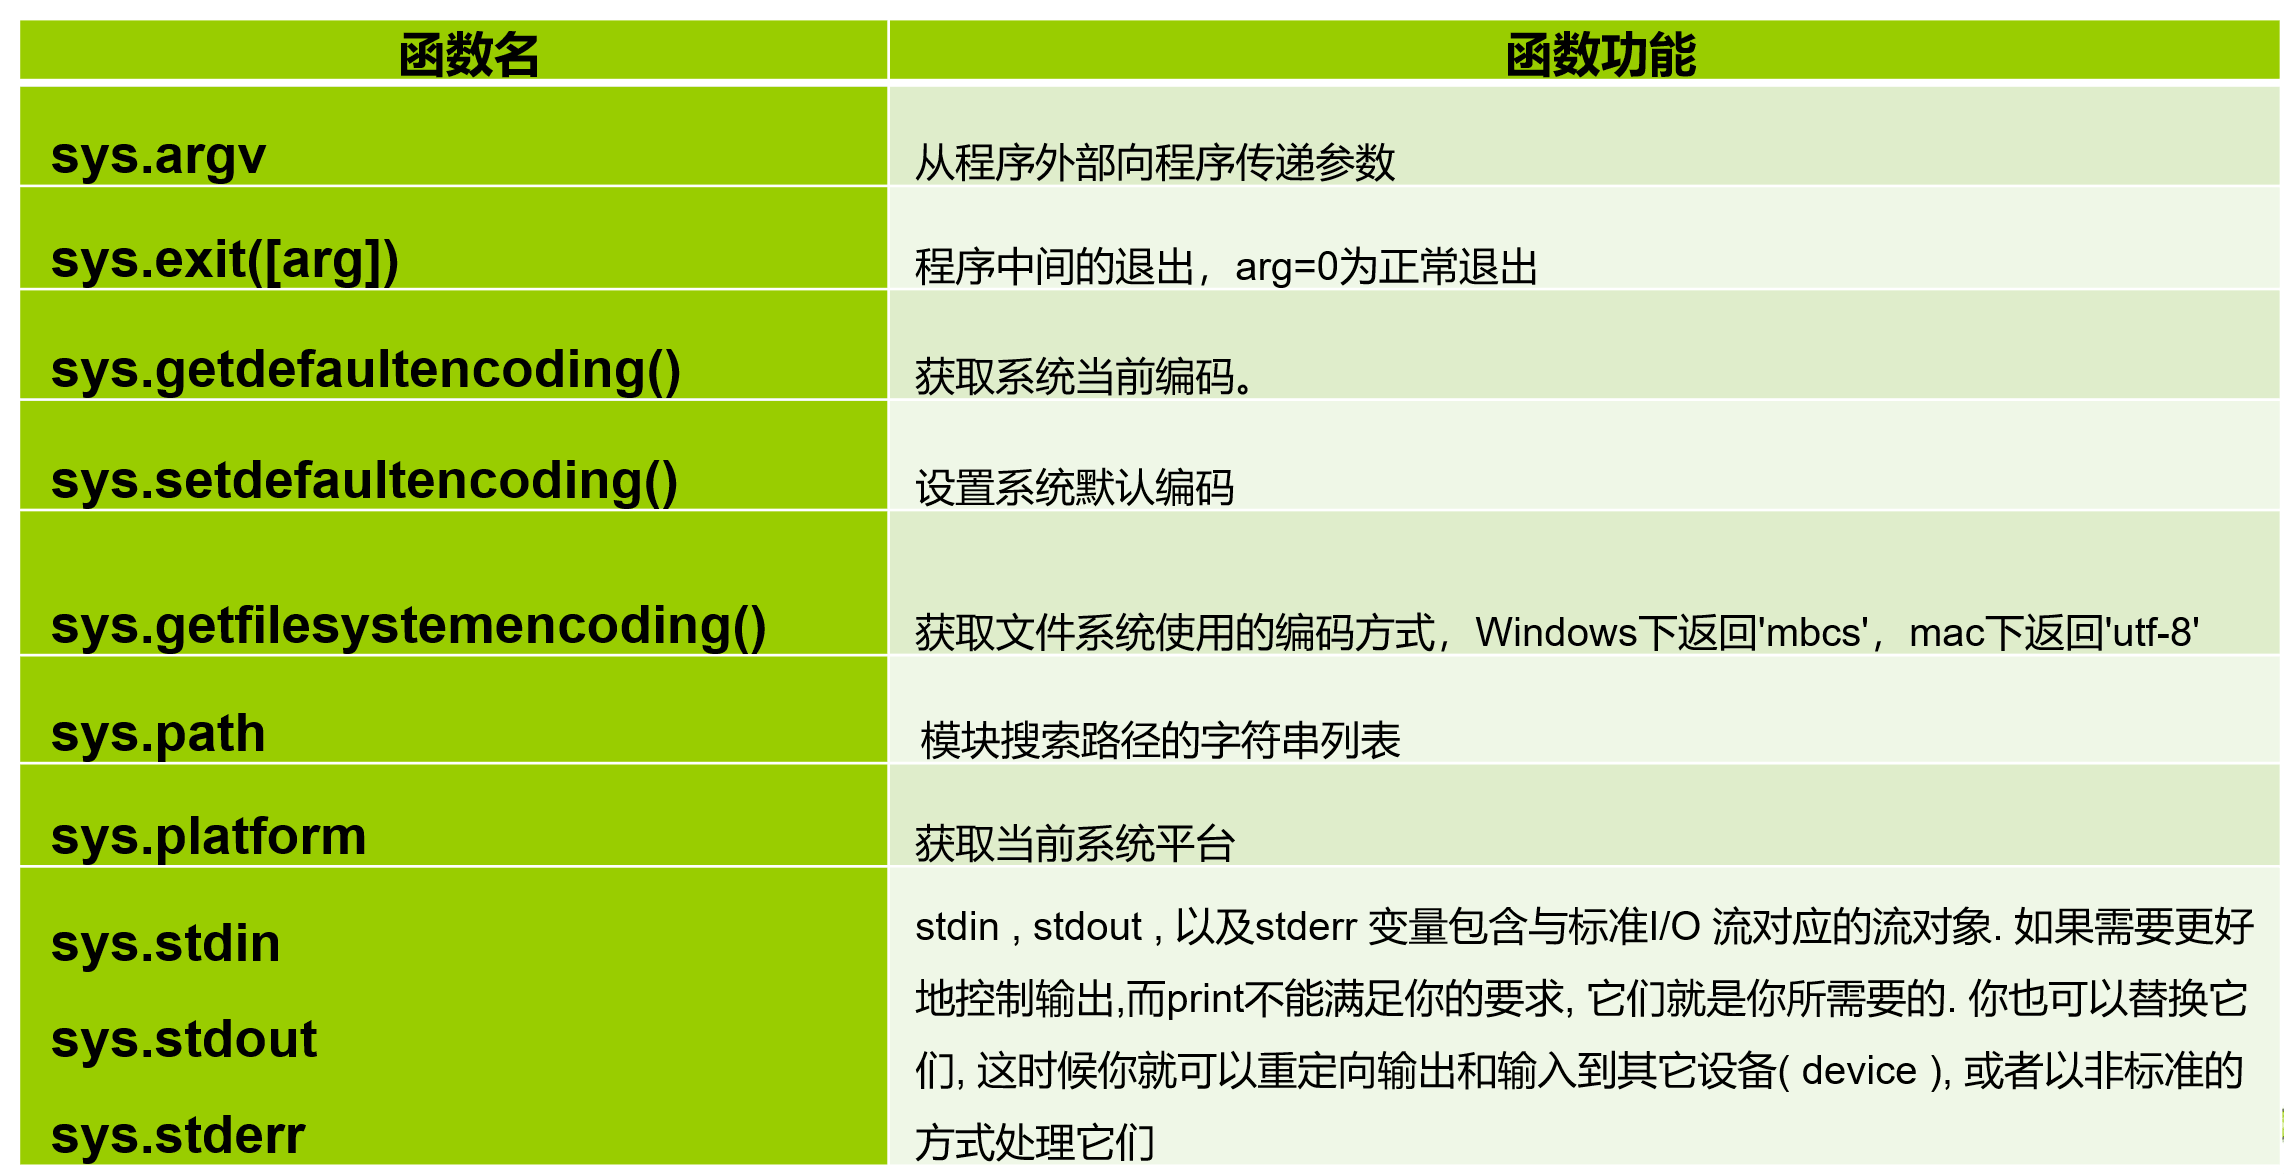
sys
提供python运行环境的变量和函数
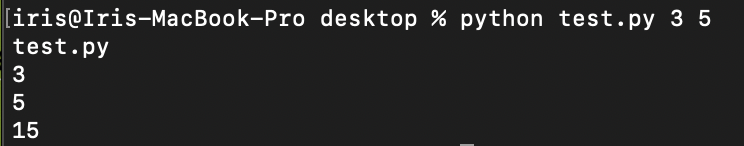
不使用input()向程序输入值:
1 | sys.argv[0] # 程序的文件名 |
1 | import sys |
标准输入输出:
sys.stdin
sys.stdout
1 | s = sys.stdin.readlines() #标准输入,完成多行输入 |